Welcome to the Philadelphia Campaign Finance Data Explorer
Philadelphia is a city of dichotomies. The poorest big city in America is also home to some of the wealthiest real estate, banking, and telecommunications companies in the world—not to mention universities with billions of dollars in the bank. These wealthy and powerful interests help shape the city’s political and economic agenda in many ways.
Analyzing campaign contributions can help demystify which particular individuals, companies, and interest groups are aiming to influence elected officials.
We designed the Philadelphia Campaign Finance Data Explorer to help the public better understand how money in politics shapes Philadelphia.
We have created four online “tools” that help you to explore the data in a variety of ways. Scroll down or click on the links below to go straight to the tool you want to explore.
For more analysis of the tools and the data, check out our Who Runs Philly? blog series.
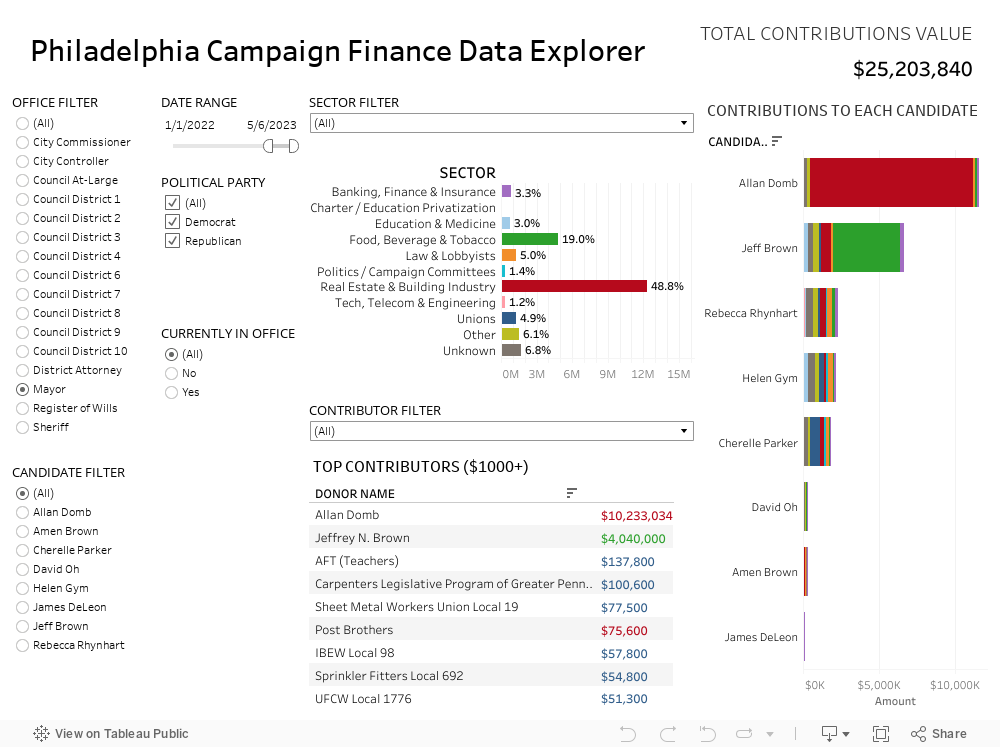
Philly Campaign Finance Data Explorer

The original campaign finance explorer tool; this allows you to see how much money has been donated directly to local campaigns since 2014.
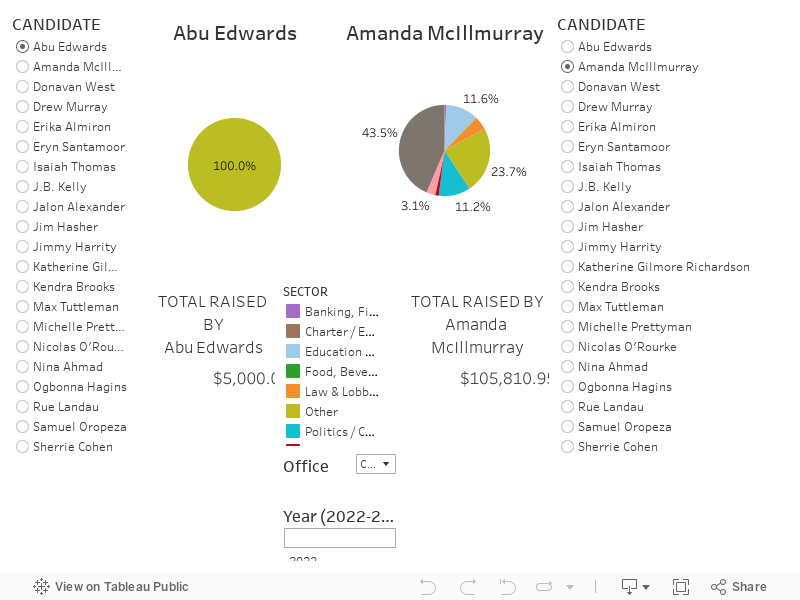
Candidate Head to Head Comparison

The Head to Head tool allows you to easily compare fundraising for candidates.
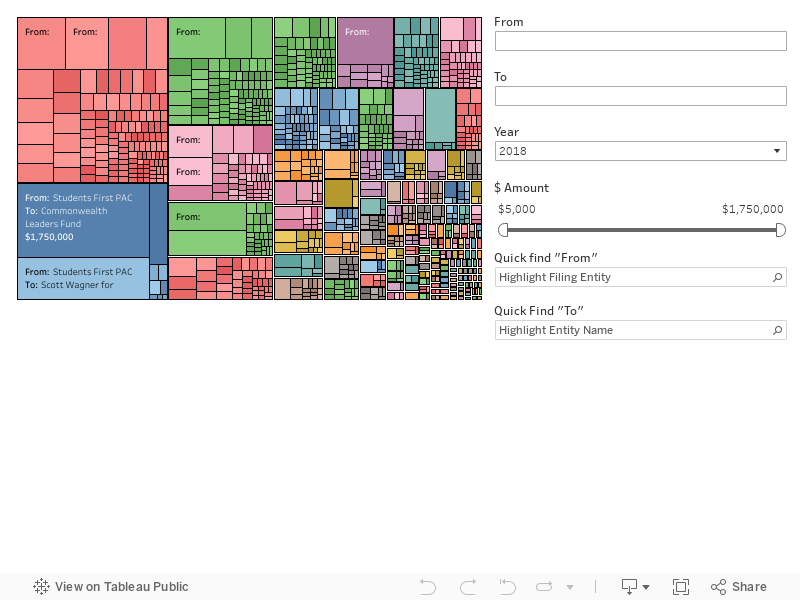
Campaign Expenditures (2014-2018 Only)

The Campaign Expenditures tool allows you to see exactly where campaigns spend their money.
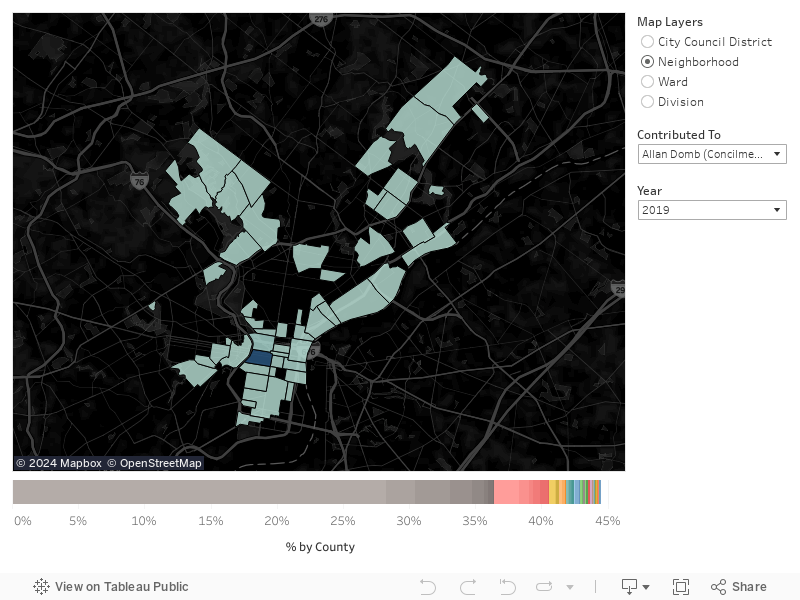
Campaign Financing Map (2014-2019 Only)

The Campaign Financing Map allows you to interact with the data about where campaign donors are geographically.